Coronavirus: The end is starting
This is a war, war against a real virus, spreading into the whole world
The prediction calculations, made on some dates Links to predictions
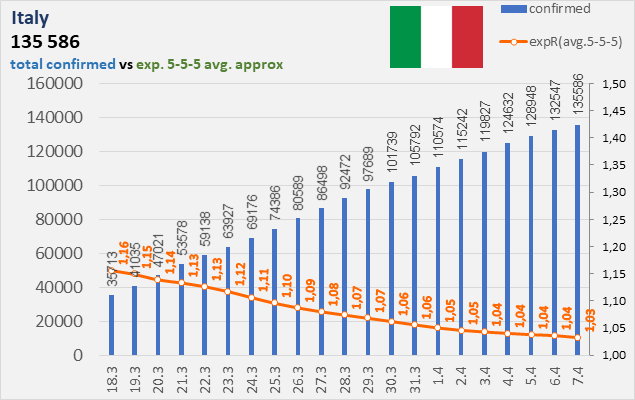
Graphs presentation here, without predictions: for instance, the situation in Italy at the 7th of April 2020: (more graphs and actual pages available at Links to graphs)
Here will be soon available many graphs, to see how the coronavirus is spreading between population in individual countries. Now, many graphs are starting from HERE (2020-04-07, all countries, where, say, more than 500 confirmed cases at that time)
Next day here - 2020-04-08; at the end of this page you can see, which countries exceeded a limit of 500 confirmed coronavirus infected people.
And here is the most important page of this web, the prediction to the future. Now some about 40 countries, soon will be added some another, also round 40. There are round the whole world at about 80 countries, where are some more then 500 confirmed cases of coronavirus infected people (or much, or much much more). Individual forecasting and prognosis for every one country, that is affected say by more than 300, or 1000 confirmed cases. This forecasts were made from the DATA present at April 8, 2020. There will be added another, day by day.
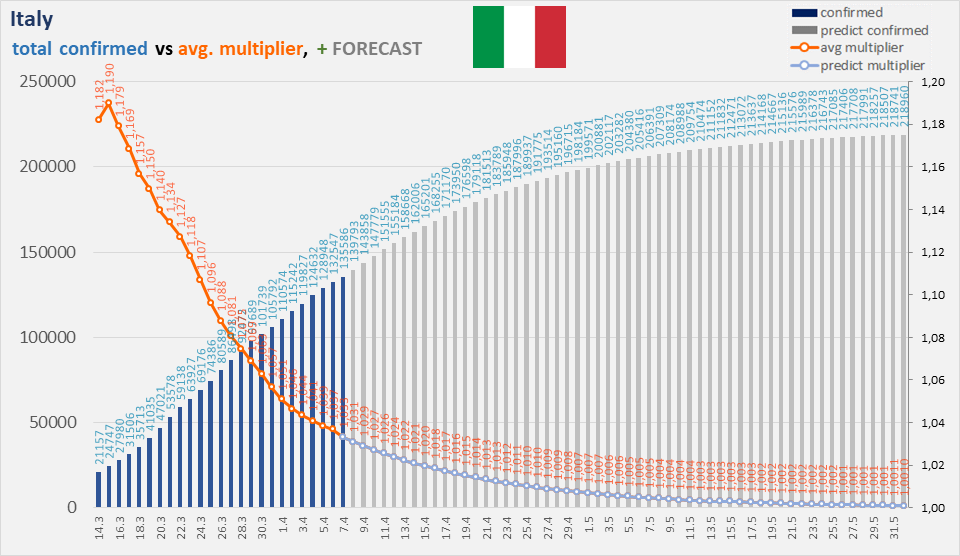
Coronavirus long time Predictions calculated at 2020-04-08
Made thoroughly by exact mathematical and graphics calculations and modelings, based on real statistics data available.
Even if it does not look like that now, (Italy, Spain, US, Germany), the epidemy is starting to decline. That means, that in every one that named country will not be confirmed daily more new cases, than the day before. That is the fact in many mostly affected countries several days ago, or will become in few next days in every one such country, where it did not happen until now.
From that time, the first week of the April, 2020
The epidemy in every country will last not more than about 30, 50 or 70 days, depending on how much is the population affected there.
Graphs updated daily.
end of explanations, graphs presentation is here: for instance, the situation in Italy at the 7th of April 2020: (more graphs and actual pages available at Links to graphs)
and the prediction calculations, made on that same date (more actual and more countries at Links to predictions)
Some interesting links and sources about Coronavirus
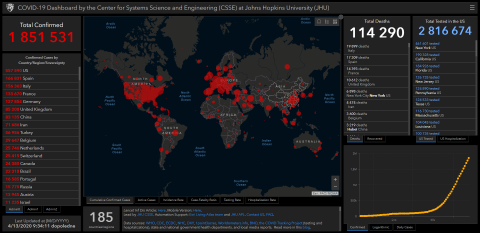
COVID-19 Dashboard by CSSE at JHU (gisanddata.maps.arcgis.com)
COVID-19 Real Time Updates (coronavirus.1point3acres.com)
COVID-19 Cases Data (data.humdata.org/dataset)
COVID-19 Pandemic - Humanitarian Data Exchange (data.humdata.org/event)
WHO situation reports, latest updates on the novel coronavirus outbreak (www.who.int)
Coronavirus disease COVID-19 – Guidelines for general care (www.uptodate.com)
COVID-19 – information and measures (www.upol.cz)
An interactive web-based dashboard to track COVID-19 in real time (www.thelancet.com)
Outbreak of Novel Coronavirus Disease (www.szu.cz)
WHO EMRO COVID-19 Related links (www.emro.who.int)
European Centre for Disease Prevention and Control (www.ecdc.europa.eu)
Novel Coronavirus Information Center (www.elsevier.com)
Novel Coronavirus (COVID-19) Cases Data - Humanitarian Data Exchange (data.humdata.org)
Coronavirus Update (Live) Worldometer.info (worldometer.info)
COVID-19 Dashboard Real Time Updates COVID-19 Cases Data COVID-19 Pandemic
WHO coronavirus reports Coronavirus Guidelines Info and measures Interactive dashboard


30120-1=fulltext.png)
Coronavirus Disease WHO Related links Coronavirus Infocenter European Centre Covid


Novel Covid 19 download Coronavirus Update (Live)

